EV Charging Curve Explained: Why Peak kW Doesn’t Tell You Charging Speed
The peak kW figure on a spec sheet describes a moment, not a session, and the shape of the curve decides how long you actually wait.
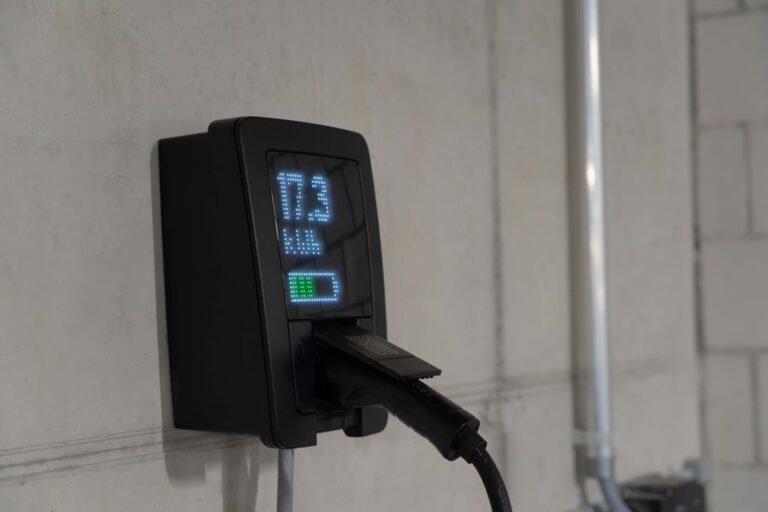
The peak kW figure on a spec sheet describes a moment, not a session, and the shape of the curve decides how long you actually wait.
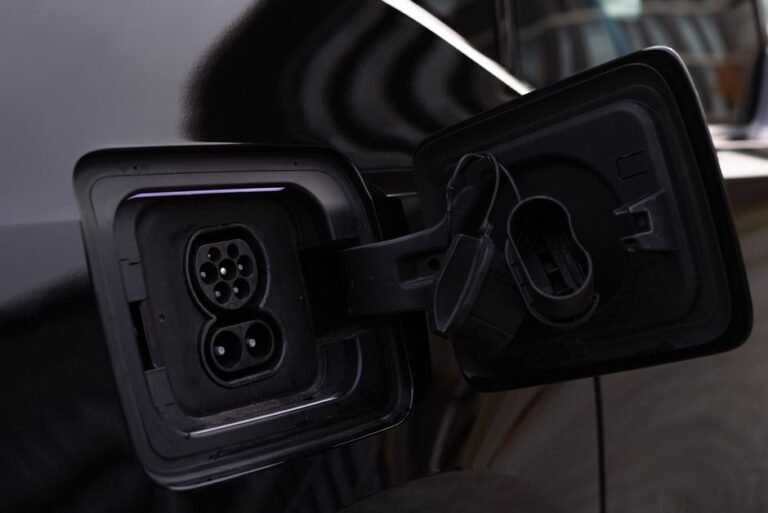
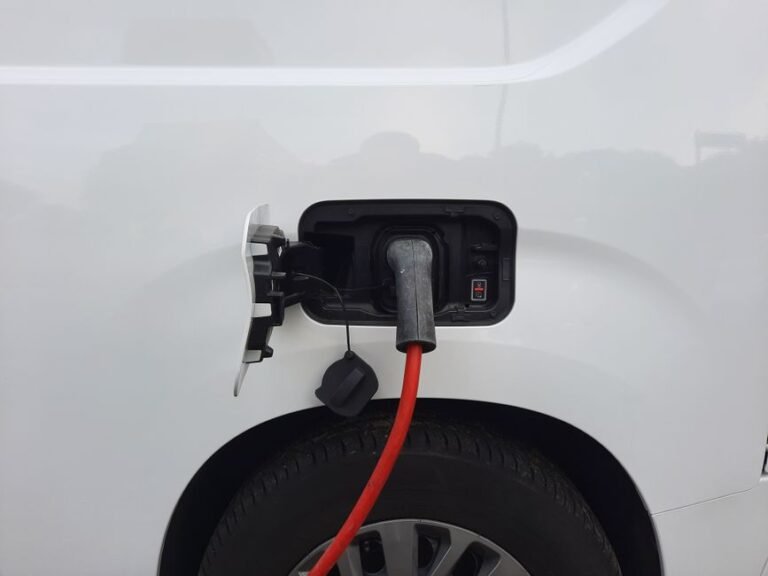
Heat marks, bent pins, damaged seals and a sticky latch are the warning signs to look for on a used EV’s charging port, followed by a real charging test.
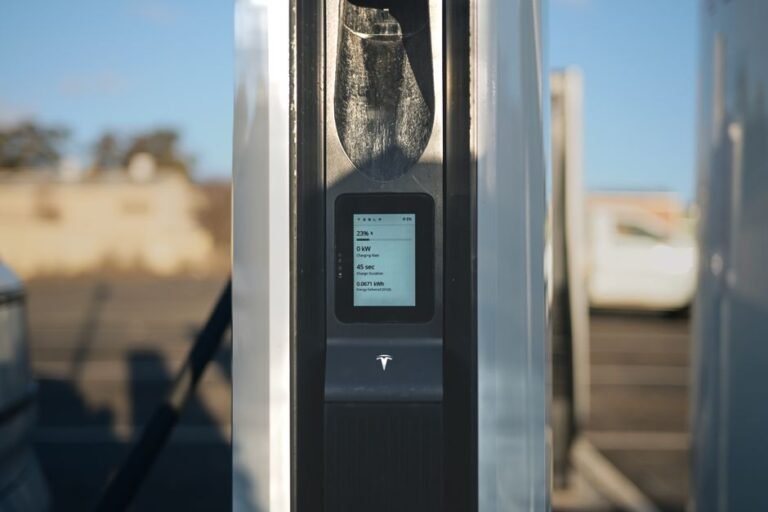
A charging network membership only pays off if you buy enough energy on that one network each month for the per-kWh discount to cover the fee.
MPGe compares an EV with a gas car, but kWh per 100 miles is the window sticker figure that converts directly into what driving will cost you.
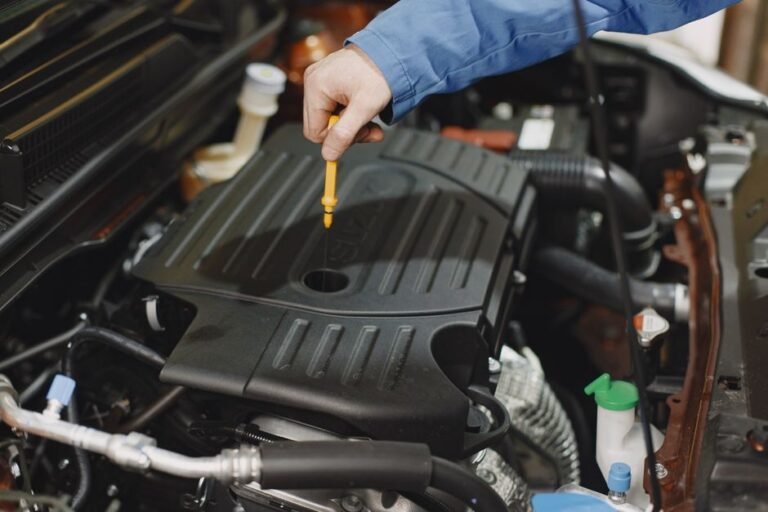
EVs skip oil changes and wear brakes more slowly, but tires, the 12-volt battery and specialist labor can narrow the maintenance gap with gas cars.
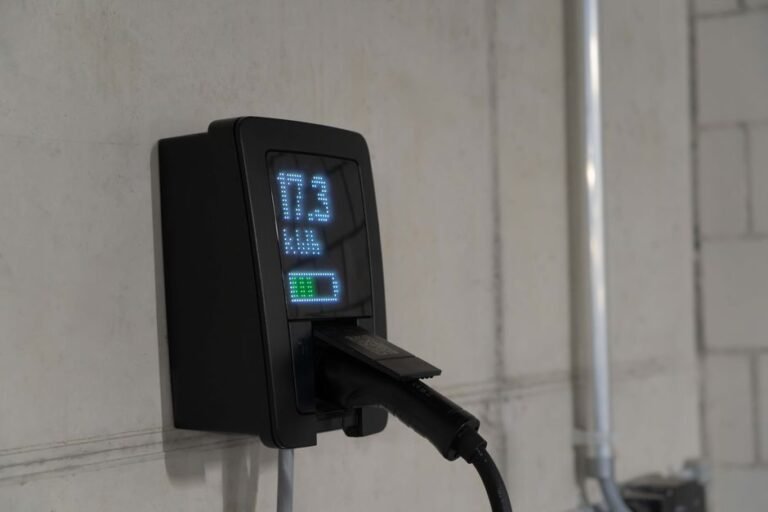
Charging losses, utility fees, time-of-use windows and public charging all push a real EV charging bill above the simple per-kWh estimate.
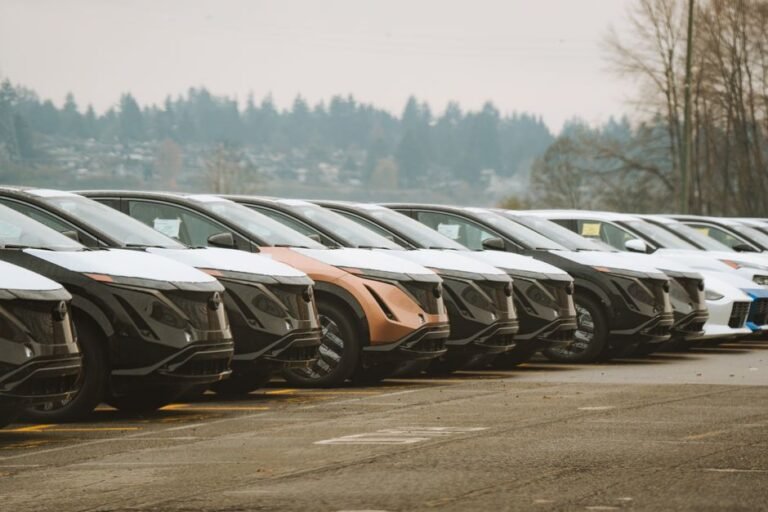
Many EVs have lost value faster than comparable gas cars, largely because new models improve quickly and new-car prices and incentives keep shifting.
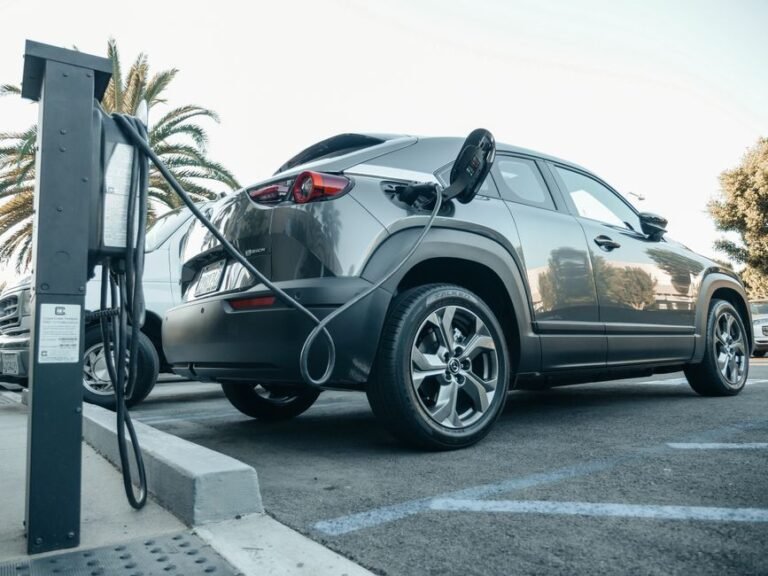
A plug-in hybrid only pays off if you charge it regularly and most of your trips fit inside its electric range; otherwise a regular hybrid is usually the simpler choice.
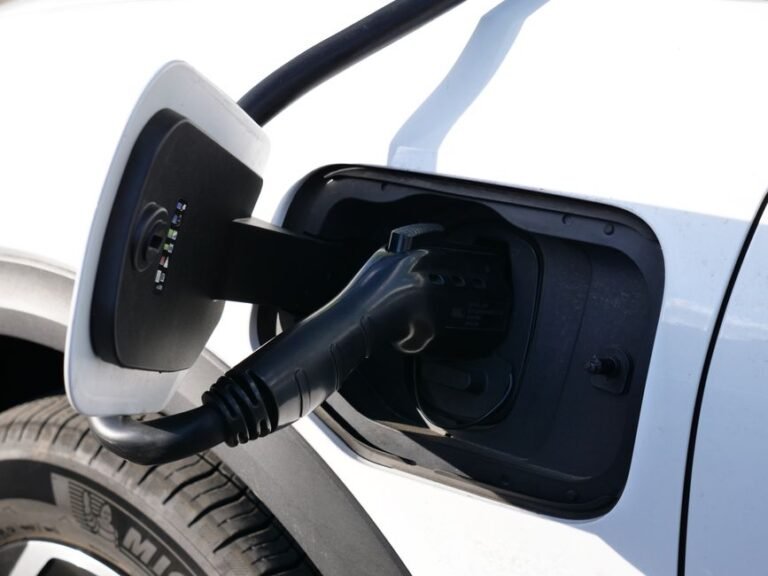
Charging time comes down to the slower of the charger and the car, how full the battery already is, and the temperature of the pack.
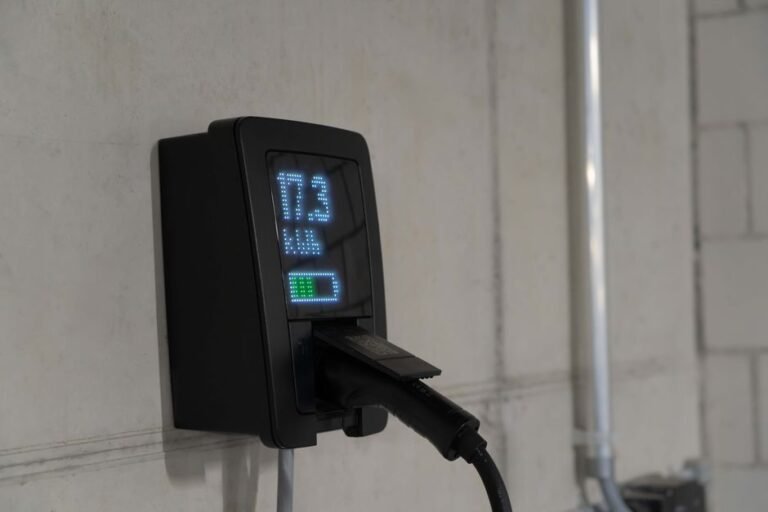
Setting a fast charger as your destination lets many EVs warm the battery on the way, which can shorten the stop, especially in cold weather.
End of content
End of content