EV Charging Curve Explained: Why Peak kW Doesn’t Tell You Charging Speed
How fast will your EV charge at a fast charger? The peak kW number on the spec sheet won’t tell you, because most cars only hold that rate for a few minutes. With the EV charging curve explained in plain terms, the real answer is about how long the car stays near its peak and how quickly it tapers off.
Two cars with the same advertised peak can finish a 10 to 80 percent session many minutes apart. The curve is the difference.
What the curve shows
A charging curve plots power against state of charge. Charging power typically climbs to its highest point when the battery is fairly empty, then the car’s battery management system steps it down as the pack fills, to limit heat and stress on the cells.
Some cars hit a high peak and drop quickly. Others start lower but hold a steady plateau through the middle of the battery. On a road trip, the flat plateau often wins.
The EV charging curve explained: why peak kW misleads
The peak is usually reached only under ideal conditions: a warm pack, a low starting charge and a station that can deliver full power. Miss any one and you may never see it.
- Starting charge: arrive at 50 percent and you skip the fastest part of the curve entirely.
- Pack temperature: a cold battery accepts far less power until it warms, which is what battery preconditioning for fast charging is designed to fix.
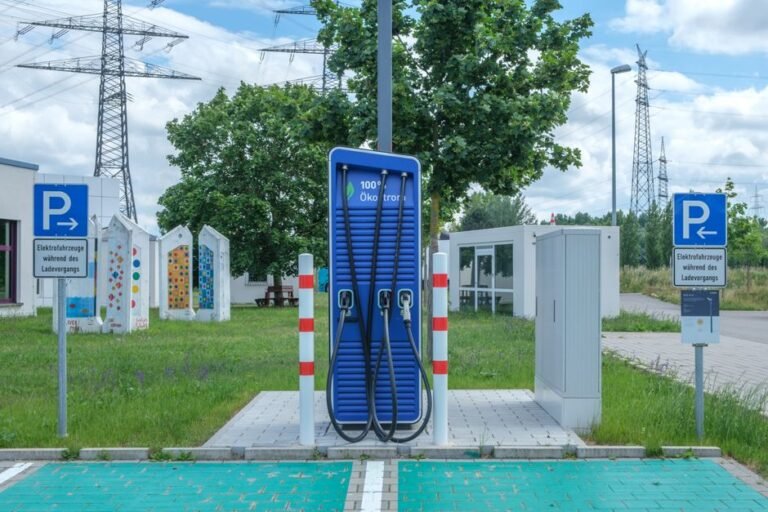
- The station: some sites split power between neighboring stalls, so a busy charger can deliver less than its label.
- Pack size: a larger battery at the same kW still takes longer to add the same percentage.
We cover these factors in more depth in what affects EV charging time.
Better numbers to look for
The most useful figure is time from 10 to 80 percent, which many manufacturers now quote. It folds the whole curve into one number you can compare. Even better is miles or kilometers added in a fixed time, say 15 or 20 minutes, because it also accounts for efficiency. A frugal car adding power slowly can match a thirstier car charging faster.
Independent testers and owner forums often publish measured curves for specific models. These are worth checking before you buy if you road-trip often, since quoted times are typically measured in favorable conditions and real sessions vary with weather and station health.
Using the curve on a trip
Because power tapers as the battery fills, the last stretch to 100 percent is usually the slowest. On most EVs, two short stops that keep you in the fast middle of the curve beat one long stop that charges to full.
Arriving with a low but comfortable charge, typically somewhere around 10 to 20 percent, puts you at the start of the steep part of the curve. Leaving once power drops off, often around 70 to 80 percent, avoids paying for the slow tail. Exact break points vary by vehicle, so watch the charging screen for a few sessions and note where your car slows down.
The U.S. Department of Energy’s Alternative Fuels Data Center has background on charger levels and public station locations.
When you compare cars, ignore the peak headline and ask for the 10 to 80 percent time. That number already includes the curve.